
Surf Forecasts Like a Pro: Buoys, Best Sites and Where to Check the Waves
How forecasters read ocean buoys, which surf forecast sites are free and which are worth paying for, which tools suit which coast, plus webcam and surf spot sites. With prices, sources and a list of what we could not verify.
この記事は現在、英語のみで提供されています。
Intro
Every surf forecast starts in the same place: a storm somewhere far out at sea. Wind blows over a stretch of water, builds waves, and those waves travel for days until they reach a coast. A forecast is a computer model's guess about that journey. A buoy is a measurement of what actually arrived at one point.
Professional forecasters use both. They run the model, then check it against the buoys. This guide explains how that works, so you can do the same, and then lists the free and paid sites, which ones suit which coast, where to find webcams, and where to look up surf spots.
One note on how we wrote this. "Best" in surf forecasting is partly a matter of taste and partly a matter of where you surf, and nobody has run a head-to-head accuracy test of every site on every coast. Where we recommend something, we say what the recommendation rests on. Where we could not confirm a detail, we say that too, and the last section collects those gaps. Prices are as published when we checked, in October 2026, and they change.
How a forecast is made
Forecasters need a few ingredients: wind speed, how long the wind blows, and the distance it blows over, called the fetch. Wikipedia's article on surf forecasting lists swell height, direction and period, plus the shape of the sea floor, tides and local weather, as what turns offshore swell data into an estimate for a beach. It also says plainly that an exact prediction of the surf is impossible, but a good estimate is not.
Two kinds of swell are worth telling apart. Groundswell is generated far offshore, has a long period and usually makes better surf. Wind swell is made by local winds, has a short period and is smaller and choppier.
The computer models do the heavy lifting, but they drift from reality. The fix is to feed in buoy measurements. Sofar Ocean, which runs a network of small wave buoys, describes the idea simply: when a buoy's measurement differs from the model's value, the model's starting estimate is adjusted toward the observation, and that corrected state becomes the start of the forecast. Sofar says it has done this with its buoys' wave heights since December 2019.
The same logic works for you. The University Corporation for Atmospheric Research teaches forecasters to check whether a model started from the right place by comparing it with buoy observations. If the buoy shows 2 m at 14 seconds and your forecast site claims 1 m at 9 seconds, the forecast is wrong, and you will know before you drive to the beach.
How the pros read a buoy
A caution first. We found plenty of documentation on how professional forecasters and researchers use buoys. We did not find a source describing what individual pro surfers do day to day, so we do not claim to. What follows is the method forecasters publish and teach.
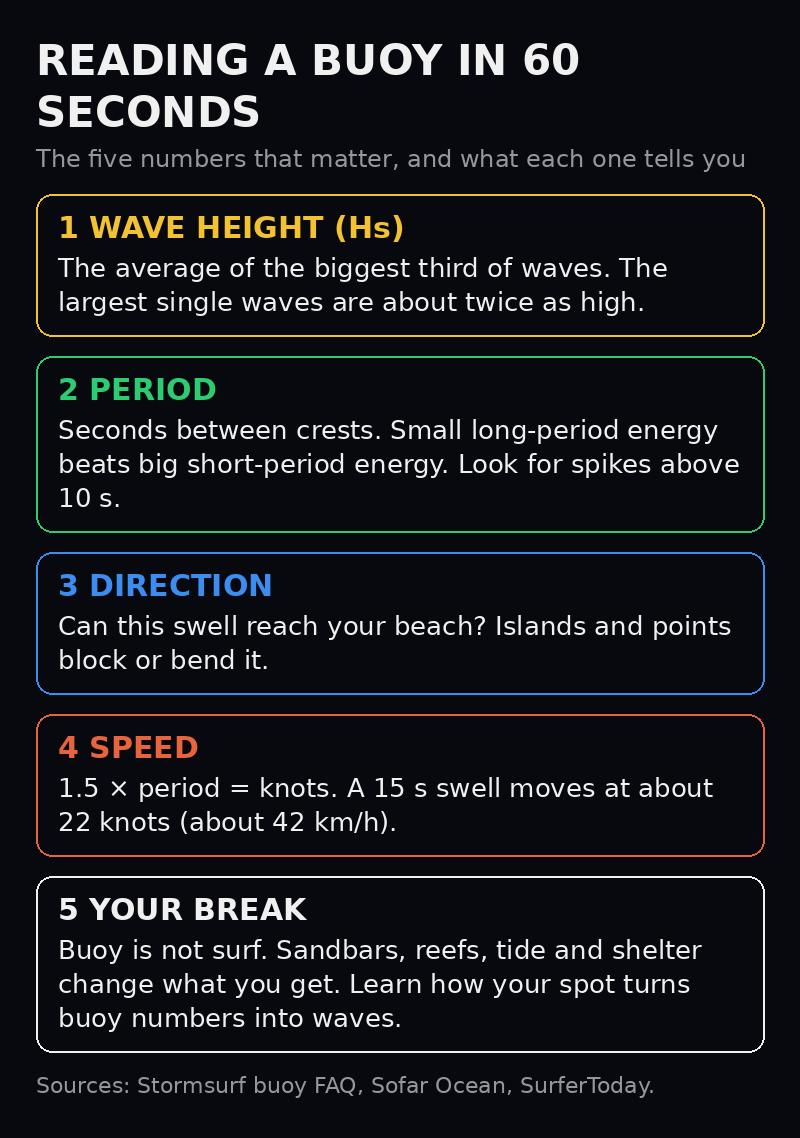
1. Wave height is not the biggest wave. Significant wave height is the average of the biggest third of waves. Sofar notes that the biggest single wave is about twice that, so a 3 m reading means some waves near 6 m. Stormsurf's buoy FAQ says the same about once an hour.
2. Period matters more than height. The period is the time between wave crests. Stormsurf puts it bluntly: small amounts of long-period energy are far more rideable and powerful than larger quantities of short-period energy. Look for energy spikes at periods above 10 seconds.
3. Direction decides whether the swell reaches you. Stormsurf warns that swells passing a buoy are not necessarily heading toward the nearest beach, and that islands, points and wrapping reduce swell size.
4. Speed tells you when it arrives. Multiply the period in seconds by 1.5 to get the speed of the swell group in knots. Individual waves travel about twice as fast, but it is the group that carries the energy. So a 15 second swell moves at about 22 knots, roughly 42 km/h.
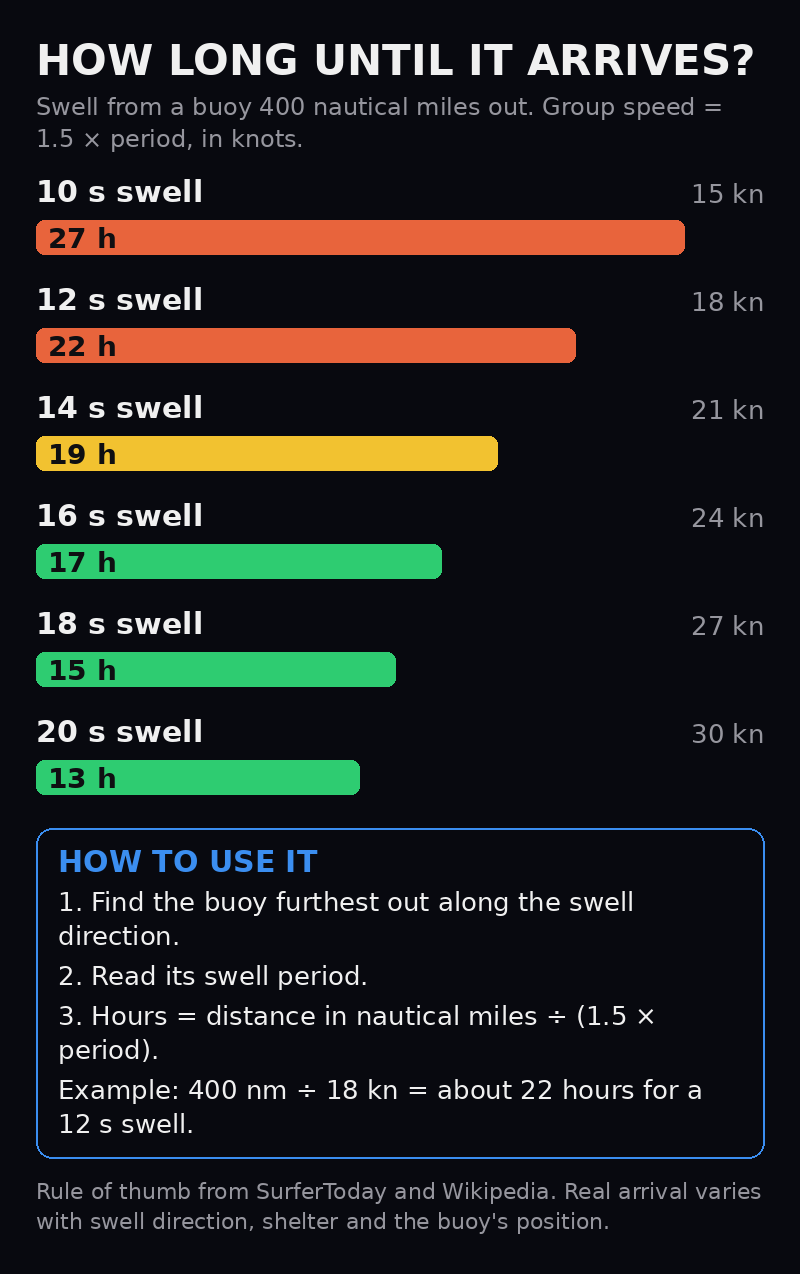
This is the upstream-buoy trick. Find the buoy furthest out along the swell direction, read its period, and divide the distance in nautical miles by the speed. The example in the SurferToday article gives about 22 hours for a 12 second swell from 400 miles. The chart above is our own calculation from the same rule: 400 nautical miles at 10 seconds takes about 27 hours, at 20 seconds about 13. Stormsurf says that for buoys 100 nautical miles or more offshore, swell may take roughly 4 to 36 hours to reach the coast depending on where the buoy sits. In Hawaii, Caldwell's paper (below) states that a northwest swell with 17 to 20 second periods takes roughly three hours to travel from Oahu to Maui.
5. Buoy numbers are not surf height. Between the buoy and the beach, reefs, sandbars and shallow shelves change the wave. Stormsurf's advice is to combine buoy data with local knowledge of nearby breaks.
That last step can be made into a formula once you know your spot. The best documented example is Oahu's North Shore. A research paper by Caldwell used a University of Hawaii Waverider buoy about 5 km northwest of Waimea Bay, in roughly 200 m of water and operating since December 2001. By comparing 404 buoy readings with observed surf, he found a correlation of 0.9486. His method turns the buoy's wave height into a breaking height and then applies a correction. It also tells you where it fails: it underestimates in very low, long-period conditions and overestimates for swells under 10 seconds. The paper also notes that the traditional Hawaiian surf scale is roughly half the trough-to-crest height, which is why a Hawaiian "6 foot" report can be a much bigger face than you expect. The paper says the method is empirical research and does not claim the National Weather Service uses it operationally.
A routine you can copy. This is our own synthesis of the points above, not a published procedure.
- Check the forecast site for the next three to five days.
- Open the nearest buoys and an upstream buoy. Compare the height, period and direction with what the site predicted.
- Use the period and distance to estimate when the swell reaches you.
- Look at the webcam (see below) or the spot's own history to learn how your break turns those numbers into waves.
A worked example: from a Hawaiian buoy to the North Shore
Here is the method applied to real geometry. This is a calculation, not a recorded swell event: we could not fetch live buoy readings, so the numbers below come from published distances and the 1.5 × period rule.
The setup. NOAA buoy 51001 sits northwest of Oahu. Caldwell's paper puts it roughly 400 km west-northwest of the island; SurferToday, describing the three buoys NOAA added in 2009, says 270 miles northwest, about 435 km. So the distance is somewhere between 400 and 435 km. Closer in, the University of Hawaii Waimea buoy sits about 5 km northwest of Waimea Bay.
The swell. Suppose 51001 shows a long-period northwest swell, which is the kind that matters on the North Shore. We use the 17 to 20 second range that Caldwell's paper describes.
| Swell period | Group speed | Time from 51001 to Oahu (400 to 435 km) | Time from the Waimea buoy to the bay (5 km) |
|---|---|---|---|
| 17 s | 25.5 knots, about 47 km/h | about 8.5 to 9.2 hours | about 6 minutes |
| 20 s | 30 knots, about 56 km/h | about 7.2 to 7.8 hours | about 5 minutes |
What this tells you.
- The far buoy gives you most of a working day of warning. If 51001 shows 17 to 20 seconds in the morning, the first of that swell reaches Oahu that afternoon or evening.
- The 20 second energy arrives roughly an hour or more before the 17 second energy. That is why surf often builds in stages as the longest periods show up first.
- The nearby Waimea buoy gives you minutes, not hours. Its job is different: Caldwell used it to turn buoy wave height into surf height at the bay, finding a correlation of 0.9486 across 404 readings. Far buoys tell you when, near buoys tell you how big.
- All of this assumes the swell is heading straight at Oahu. A buoy's reading says nothing about whether the swell is aimed at your beach.
Use the calculator below to try other periods and distances.
Where buoy data lives
Buoys are mostly public data. The networks below are the ones we could confirm.
| Country or region | Network | What we could confirm |
|---|---|---|
| USA | NOAA National Data Buoy Center (NDBC) | About 90 buoys and about 60 coastal stations per Wikipedia; all buoys report wave height and period |
| USA | Coastal Data Information Program (CDIP), Scripps | Started 1975; real-time data online since 1996; directional buoys measure height, period and direction; by 2017 it maintained stations at 271 locations (one SurferToday caption says "over 90 surf buoys", so the exact count is unclear) |
| Hawaii | NOAA buoys 51001, 51000, 51100, plus the University of Hawaii Waimea buoy | NOAA's three buoys were deployed in April 2009 to improve warnings of northern swell |
| UK | Cefas WaveNet | Running since 2002; directional Waverider buoys; real-time data viewable free |
| Ireland | Marine Institute wave buoy network | Two sites only: Galway Bay and off Belmullet; data from 2008 |
| France | Candhis (Cerema) | About 99 measurement campaigns including overseas territories; open licence; warns that two lighthouse buoys likely underestimate wave height |
| Spain | Puertos del Estado | 15 outer buoys plus 12 coastal buoys; record 13.95 m significant wave height at Estaca de Bares on 4 November 2023 |
| Portugal | Instituto Hidrográfico | Two buoys at Nazaré, one oceanic and one coastal, measuring waves, currents and temperature |
| Australia | Wave buoys via the Australian Ocean Data Network | Data from Manly Hydraulics Laboratory, the Bureau of Meteorology and state agencies; most feeds update hourly |
| Sweden | SMHI | Buoys at Väderöarna, Brofjorden, Knolls grund, Finngrundet and Huvudskär Ost; hourly data; open data portal |
| Worldwide | Sofar Spotter | Network of about 400 to 500 buoys reporting hourly; a free archive covers 2019 to March 2022 |
Coverage is very uneven. The US has by far the most buoys, Spain runs a national network of 27, and Ireland's public network is two test sites. Raw buoy tables are also harder to read than a forecast site that blends models and buoys, which is one reason to use both.
For Norway, MET Norway publishes wave forecasts from models, including a high-resolution coastal model called WAM-800m and a Nordic Seas model. We did not find a public buoy network for Norway's coast on that page, so we do not claim one exists.
Forecast sites: free and paid
Every surf site mixes models, buoys and local knowledge differently. The practical question is what you get for free and what you get for paying. Here is what we confirmed from the sites themselves, with notes where the source is a third party.
| Site | Free | Paid | Notes |
|---|---|---|---|
| Surfline | Free account with limited forecasts and a written morning report from 2 pm; only the furthest-out day to watch across the 16-day forecast | Premium $119.99 per year on annual renewal; Premium with ads $69.99 per year; Premium+ $149.99 per year shared by three people (about $50 each). US prices from 8 April 2025 | Founded 1985 as a pay-per-call surf line; first live camera in 1996; over 500 streaming cameras at 150 breaks per Wikipedia (an older figure); installed its own offshore buoys in 2006 |
| Surf-Forecast | Detailed forecasts, multi-swell display, tide times, a map for finding breaks, and links to webcams | In the US App Store, Premium $4.99 per month or $34.99 per year: 16-day hourly forecasts, custom alerts, ad-free | Covers over 7,000 breaks; links to cams owned by locals rather than installing its own |
| Windguru | Forecasts for many spots | A PRO tier; SurferToday lists €2.90 a month, but that figure is not from Windguru's own page | Its help page names the models GFS, WRF, AROME, ICON, HARMONIE, NAM, HRW, GDPS, GWAM and EWAM; which are free is not stated |
| Windy | Weather maps, a free and ad-free webcams map, and a surf spots layer | Premium; yearly plans start at €18.99 according to a Windy community post | Premium adds 1-hour steps, a 10-day outlook, and tide forecasts in the waves tab; models include ECMWF and GFS |
| Swellnet (Australia) | Basic: 3-day forecasts, ad-free | Lite AUD 4.15 per month or 49.80 per year; Pro AUD 7.33 per month or 87.95 per year, including surfcams with no timeout and replays | Local forecaster notes and daily surf reports for selected regions |
| Windfinder | Forecasts for over 45,000 locations, per SurferToday | Windfinder Plus (price not confirmed) | Germany-based; wind-sports focus |
| Wisuki | Spot search, alerts, tide charts, webcams | Wisuki Pro (price not confirmed) | Spain-based, community-driven spot discovery |
| BreakFinder | Core spot data and 7-day forecasts | Optional premium extends to 16 days | Scores spots from 0 to 100 |
| NOAA and NDBC | Raw buoy data and forecasts, all free | None | The source material for much of the above |
A word on Magicseaweed, once the most popular free forecast. Surfline acquired it in 2017 according to Wikipedia, and the free service was later shut down: BreakFinder writes that "three million MSW users lost a free tool overnight". If you used to rely on it, the closest free alternatives today are Surf-Forecast, Windguru and Windy.
Is Surfline worth the money? A good rule is to use the free tiers for a month, because they give you the raw ingredients. Surfline's own support page says paid members get written analysis for today, tomorrow and any days worth watching in the 16-day forecast, while free users get only the furthest-out day to watch. BreakFinder, itself a competitor, notes recurring complaints about auto-renewal charges, so set a reminder if you take a trial.
Which tools for which coast
This is our judgement, built from where each tool has strong coverage or local focus, not from an accuracy test. The orange and grey entries are the ones with the thinnest evidence.
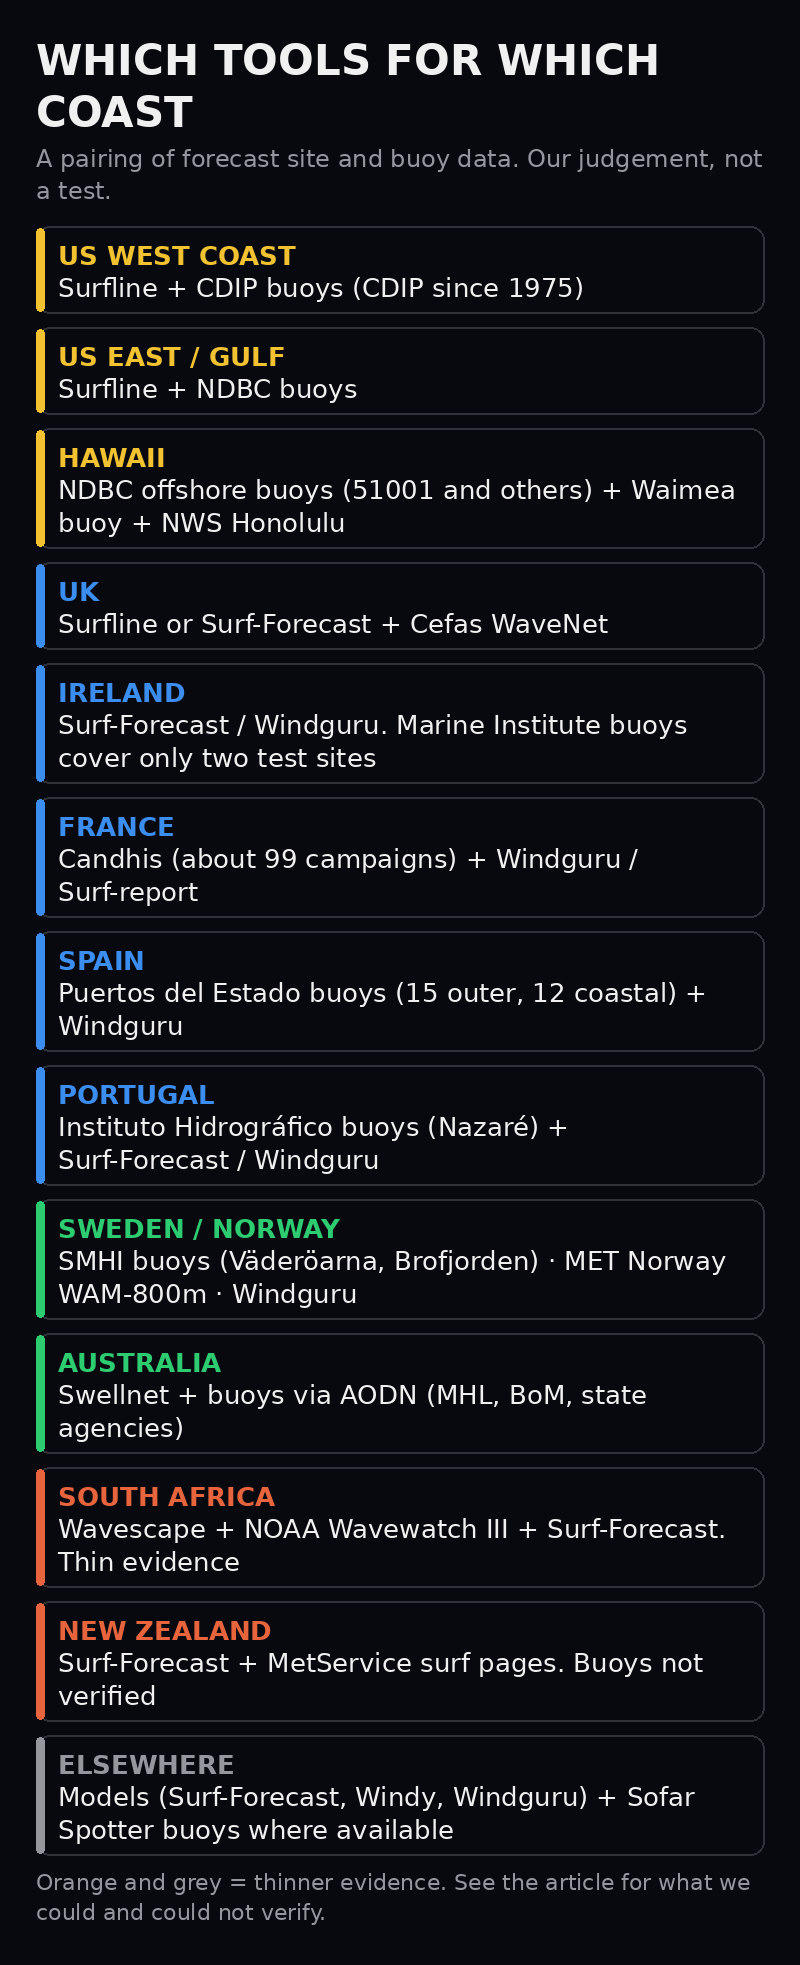
US West Coast. CDIP's buoys were built for exactly this: directional measurements of height, period and direction, with swell models that SurferToday says became a favourite with surfers. Pair them with a forecast site that has a human forecaster.
US East Coast and Gulf. NDBC has the broadest buoy network. For forecasts, use the same sites as the West Coast; we did not find a source ranking one over another here.
Hawaii. Hawaii is a well-documented case of buoy-driven forecasting: NOAA buoys far to the northwest and northeast give early warning, and the Waimea buoy tells you what is about to hit the North Shore. The National Weather Service office in Honolulu also issues text surf forecasts.
UK and Ireland. Cefas WaveNet gives the UK a good free source. For Ireland, the public buoys are limited to two test sites, so lean more on forecast models and local cams.
France, Spain and Portugal. Each has an open national buoy source: Candhis, Puertos del Estado and the Instituto Hidrográfico. Compare these with the forecast on Windguru or Surf-Forecast. Nazaré is the extreme case: the Hydrographic Institute runs two buoys there, one oceanic and one coastal, and publicised their maintenance ahead of the big-wave season.
Sweden and Norway. SMHI's buoys at Väderöarna and Brofjorden are the main Swedish observations. Both are in the Skagerrak. Of the five SMHI positions we could read, none is in the Kattegat, so for Kattegat surf you will rely on models and the nearest Skagerrak buoys. On the Norwegian side, MET Norway's WAM-800m covers the coast. We did not find a Norwegian buoy to pair it with.
Australia. Swellnet is a local specialist with forecaster notes, and the buoy data is published through the Australian Ocean Data Network. This pairing looks the strongest outside the US.
South Africa and New Zealand. Evidence is thin. For South Africa, Stormsurf's list points to the Wavescape surf report and a NOAA Wavewatch III bulletin for the Agulhas area; that list is old and some links may not be current. For New Zealand, MetService has surf location pages, but we could not read their content, and we did not confirm a buoy source.
Everywhere else. Where public buoys are scarce, which is much of the tropics, you are mostly reading models. Use the free model sites, and check whether a Sofar Spotter buoy happens to be nearby. We did not find a source describing buoy coverage in Indonesia, Brazil or Japan, so we make no claim about them.
Try it
Two small tools built from the data in this article. They do not fetch live buoy readings, so they cannot show out-of-date numbers.
Find your tools
Pick your coast and get a forecast site, a buoy source and a webcam source from this article.
When does the swell arrive?
Enter the swell period on an upstream buoy and the distance from that buoy to your coast. Group speed is 1.5 × period, in knots (deep water).
About 17 h 47 min
Speed 22.5 knots (42 km/h) over 400 nautical miles.
Same distance, other periods
- 8 s33 h 20 min · 12 kn
- 10 s26 h 40 min · 15 kn
- 12 s22 h 13 min · 18 kn
- 14 s19 h 3 min · 21 kn
- 16 s16 h 40 min · 24 kn
- 18 s14 h 49 min · 27 kn
- 20 s13 h 20 min · 30 kn
Longer periods arrive first, so the longest-period energy shows up on your coast before the rest of the swell.
Rule of thumb for deep water (SurferToday, Wikipedia). Real arrival depends on swell direction, shelter and where the buoy sits.
Webcams
A webcam is the reality check on every other number. It tells you whether the forecast "3 feet at 12 seconds" looks like fun or like mush at your beach. Webcam access is also where free and paid tiers differ most, so this section compares them directly.
Free options
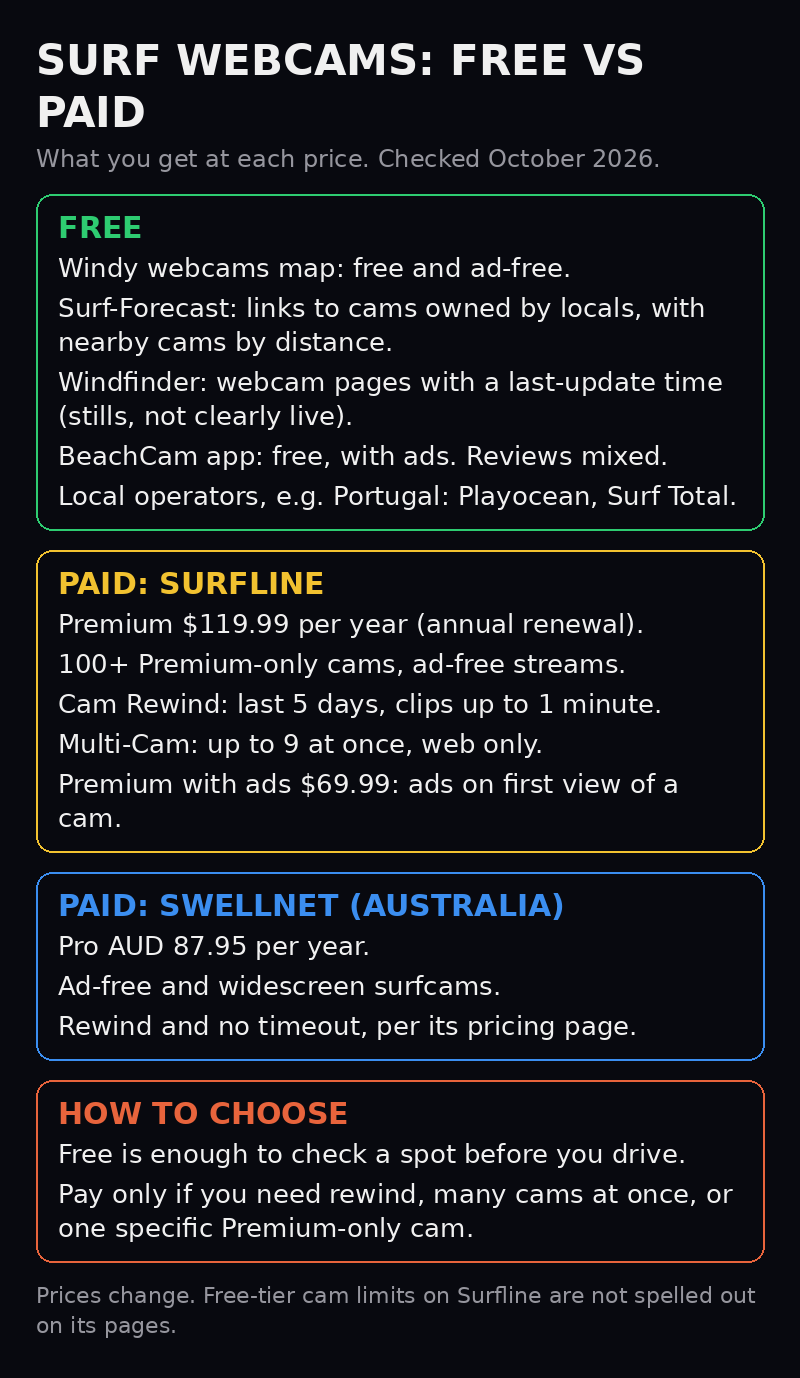
- Windy webcams map. A map that previews webcams across the world so you can see current conditions before a trip. Windy describes the Webcams Map as free and ad-free. We did not find how many cameras it holds.
- Surf-Forecast. It does not install its own cameras: "We link you straight to cams owned by locals". Each break has a webcam page, with nearby cams listed by distance, and you can submit a missing one. For Comporta in Portugal, for example, the page lists cams run by Playocean and Surf Total near Lisbon and a hotel-run BeachCam. It does not say whether each cam is live or a still, or whether any are free to view, so click through to check.
- Windfinder. Its webcam pages show an image with a "last update" time, which suggests periodically refreshed stills rather than video. People can add their own cam for free through a partner site. The page does not say whether viewing costs anything.
- BeachCam app. A free iPhone and iPad app listing live beach webcams "from Europe, Asia and the Americas", with ads and no account needed. The App Store listing shows only 5 ratings averaging 2.4 out of 5, and one review from 2018 says many cameras no longer worked. Treat it as a starting point, not a guarantee.
- Local and regional operators. The best free cams are often run by a local surf school, resort or association. The Hawaii Magazine webcam list, for example, names a Banzai Pipeline cam on Oahu as the one surf-specific spot, and also lists hotel cams that happen to show surfers. Hosts decide what stays online, so a cam that works today can vanish.
Paid options
- Surfline Premium. The biggest paid camera offer we could confirm. Surfline says Premium members get exclusive access to over 100 Premium-only cams, ad-free cam streams, Cam Rewind and the Multi-Cam. Rewind keeps only the last five days of footage, lets you scan at up to 8x speed and download clips up to one minute. Multi-Cam shows up to nine cams at once, but only on the website, not in the iOS or Android apps. Annual Premium is $119.99 on renewal. The cheaper "Premium with ads" ($69.99 a year) plays ads on the first view of any cam angle. The "Forecast only" plan has no cams.
- Swellnet Pro (Australia). AUD 87.95 a year, with surfcams that do not time out, replays, and ad-free, widescreen viewing.
- Wisuki Pro. The French App Store listing shows two paid options, €2.99 and €25.99, without saying which period each covers, and does not mention webcams on that page. SurferToday lists webcams among Wisuki's features, so check the app before paying for it.
Which to use
Free is enough for most surfers: you only need to know what the beach looks like before you drive. Pay if you need to check many spots at once, want to rewind to see how the session actually went, or your local break is one of Surfline's Premium-only cams. On Surfline's free tier, camera access is restricted according to BreakFinder, but we could not find the exact free limits on Surfline's own pages, so try it before paying.
Whatever you use, compare the cam with the buoy. A cam shows the wave right now at one spot; a buoy shows what is on its way. Together they are far more reliable than either alone.
Surf spot databases
When you travel, you need to know where to go before you know what the forecast is doing.
- Surf-Forecast lists over 7,000 breaks with spot guides and a best-time-of-year calculation.
- Windy added a Surfing spots layer with more than 4,500 spots worldwide. The community post says the data comes from Stormrider Surf Guide.
- The World Stormrider Surf Guide is a 445 page hardback from Low Pressure, priced at £45 per SurferToday, with Antony "Yep" Colas credited for identifying the breaks.
- Wisuki describes community-driven spot discovery.
- Mondo.surf also has spot guides, for example for Uluwatu. We did not review its coverage.
A simple setup
If you want one practical answer, this is ours, based on the evidence above:
- A free forecast site for the big picture. Surf-Forecast, Windguru or Windy are all free to start.
- The national buoy source for your coast, from the table above.
- A webcam for your break.
- A paid tier only if the free one leaves you guessing. Try one for a month and check the renewal date.
The tools matter less than the habit. Check the buoy, check the forecast against it, look at the cam, and write down what the spot did. After a season, you will know your break better than any model does.
What we could not verify
- Prices. Surfline's and Swellnet's come from their own pages; Surf-Forecast's from the US App Store listing; Windy's from a community post; Windguru's from a third party. All can change.
- Camera counts. The 500 cameras at 150 breaks comes from Wikipedia and may be out of date. Windy's and Surf-Forecast's camera counts, and Surfline's exact free-tier cam limits, were not on the pages we could read.
- Wisuki webcams. Listed by SurferToday but not on the App Store page we read.
- Surfline's forecast model. The pages we could read did not describe it, so we do not.
- Individual pros. We found published methods for forecasters and researchers but not accounts of how individual pro surfers read buoys.
- Regions. We did not find sources for buoy coverage in Indonesia, Brazil, Japan, New Zealand, or Norway.
- Accuracy. We found no independent test ranking forecast sites by accuracy, so "best by region" is a judgement.
- Swell travel chart. The chart is a rule of thumb for deep water; real arrival depends on direction and shelter.
Sources
- NOAA NDBC, how to decode real-time data: https://www.ndbc.noaa.gov/faq/decode.shtml
- Wikipedia, National Data Buoy Center: https://en.wikipedia.org/wiki/National_Data_Buoy_Center
- SurferToday, CDIP wave buoys: https://www.surfertoday.com/surfing/cdip-wave-buoys
- Stormsurf, buoy FAQ: https://www.stormsurf.com/buoy/mht/faqs.html
- Stormsurf, South Africa surf links: https://stormsurf.com/page2/links/safrsrprt.shtml
- Wikipedia, Surf forecasting: https://en.wikipedia.org/wiki/Surf_forecasting
- SurferToday, how fast do ocean swells travel: https://www.surfertoday.com/surfing/how-fast-do-ocean-swells-travel
- UCAR COMET MetEd, Analyzing Ocean Swell: https://www.meted.ucar.edu/oceans/ocean_swell/navmenu.php
- Sofar Ocean, data assimilation: https://www.sofarocean.com/posts/data-assimilation-part-i-bringing-ocean-observations-into-wave-forecasts
- Sofar Ocean, Spotter archive: https://www.sofarocean.com/mx/sofar-spotter-archive
- Caldwell, Hawaii surf and buoy paper (Ifremer archive): https://data-ww3.ifremer.fr/BIB/Caldwell_8WIF2004.pdf
- SurferToday, NOAA's new Hawaiian buoys: https://www.surfertoday.com/surfing/wave-and-weather-forecasts-improved-in-hawaii-by-nooa
- NWS Honolulu surf zone forecast text product: https://mesonet.agron.iastate.edu/api/1/nwstext/201910290052-PHFO-FXHW52-SRDHFO
- Cefas WaveNet: https://www.cefas.co.uk/wavenet
- Marine Institute wave buoy network, data.gov.ie: https://data.gov.ie/dataset/wave-buoy-network
- Candhis user guide (Cerema): https://candhis.cerema.fr/doc/01_UtilisationFR.pdf
- Puertos del Estado, Storm Domingos record: https://www.puertos.es/en/comunication/storm-domingos-sets-absolute-record-significant-wave-height-measured-puertos-del
- Instituto Hidrográfico, Nazaré buoys: https://www.hidrografico.pt/en/news/noticias-do-antigo-site/multiparametric-buoys-of-nazare-ready-for-the-bigwave/
- AODN wave buoy observations, Registry of Open Data on AWS: https://registry.opendata.aws/aodn_wave_buoy_realtime_nonqc/
- SMHI, wave buoys: https://www.smhi.se/kunskapsbanken/oceanografi/matningar-i-havet/vagbojar
- MET Norway Ocean: https://ocean.met.no/
- Surfline support, US price and tier updates: https://support.surfline.com/hc/en-us/articles/35208905809051-US-Price-Tier-Updates
- Surfline support, free vs Premium: https://support.surfline.com/hc/en-us/articles/32996023385243-What-do-I-get-as-a-free-vs-Premium-user
- Wikipedia, Surfline: https://en.wikipedia.org/wiki/Surfline
- Swellnet pricing: https://www.swellnet.com/pricing
- Windguru help, PRO: https://www.windguru.cz/help.php?sec=pro
- Windy community, Premium features: https://community.windy.com/topic/23730/be-one-step-ahead-with-the-advanced-features-of-windy-premium-en
- Windy community, webcams map: https://community.windy.com/topic/28923/say-hello-to-webcams-map-as-windy-keeps-innovating
- Windy community, surfing spots layer: https://community.windy.com/topic/7810/4-500-surfing-spots-round-the-world-directly-on-windy-forecast-map
- Windy, Version 43 / forecast models: https://www.windy.com/articles/36687
- Surf-Forecast.com app (App Store): https://apps.apple.com/us/app/-/id6450721636
- Surf-Forecast, webcam page: https://www.surf-forecast.com/breaks/Windies-Ngawi/webcams/latest
- SurferToday, best surf forecasting websites and apps: https://www.surfertoday.com/surfing/the-best-surf-forecasting-websites-and-apps
- BreakFinder, is Surfline worth it: https://breakfinder.surf/en/blog/is-surfline-worth-it
- SurferToday, The World Stormrider Surf Guide: https://www.surfertoday.com/surfing/the-ultimate-world-surf-spot-guide
- Windfinder webcams, Conil de la Frontera: https://www.windfinder.com/webcams/conil_de_la_frontera
- Windfinder webcams, Portugal: https://www.windfinder.com/webcams/estombar_faro_portugal
- Surfline, Feature Focus: Surfline Cameras: https://www.surfline.com/lp/feature-focus/surfline-cameras
- Surfline, Multi-Cam: https://www.surfline.com/lp/feature-focus/multi-cam
- Surfline support, How do I use Rewind: https://support.surfline.com/hc/en-us/articles/360051796171-How-do-I-use-Rewind
- Surfline support, Seeing ads on Surfline: https://support.surfline.com/hc/en-us/articles/31336305681947-Seeing-ads-on-Surfline
- Swellnet, Welcome to Swellnet Pro: https://www.swellnet.com/welcome-swellnet-pro
- Surf-Forecast, Comporta webcams: https://www.surf-forecast.com/breaks/Comporta/webcams/latest
- BeachCam, Live Surf Webcams (App Store): https://apps.apple.com/app/id1001164660
- Wisuki (App Store, French listing): https://apps.apple.com/FR/app/id646750653
- Hawaii Magazine, live Hawaii webcams: https://www.hawaiimagazine.com/?p=46202
- Surf-report.com: https://www.surf-report.com/news/ca-surfe-cette-semaine/webcam-surf-report-check-conditions-504233856.html
- Mondo.surf, Uluwatu guide: https://www.mondo.surf/surf-spot/uluwatu/guide/11687